
Related: Google Sheets as a Database: When It Works and When It Breaks
Most businesses have a Monday ritual. Someone exports three CSV files, pastes them into a spreadsheet, fixes the dates, updates the charts, and emails a summary around lunchtime. It takes two or three hours. It is slightly wrong about one week in five. And nobody else knows how to do it.
That report can build itself. Here is how to get there.
What automated reporting actually is
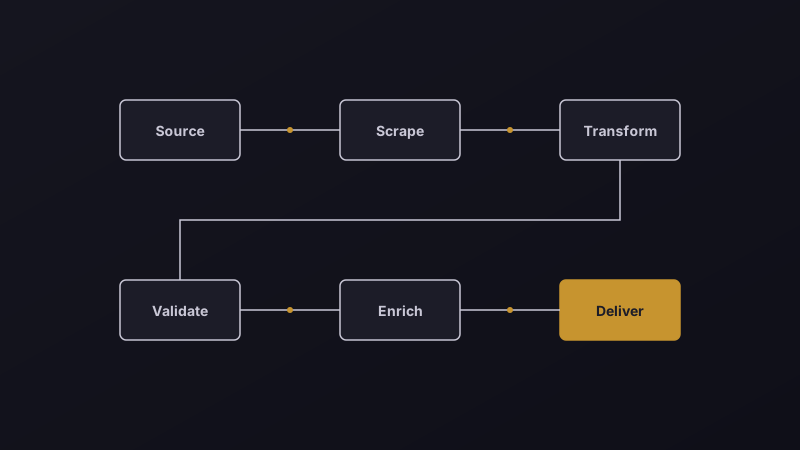
Four steps, running on a schedule without anyone touching them:
- Collect. Pull the data from each source: your store, your CRM, your ad accounts, your accounting software.
- Store. Put it all in one place, so every number comes from the same copy of the truth.
- Calculate. Turn raw records into the metrics you care about.
- Deliver. Put the result where people will actually see it.
Define the numbers first
This is the most important step, and it involves no code at all.
Take "revenue". Does it mean:
- Gross or net of discounts?
- Before or after refunds? Refunds from which period?
- Including tax and shipping, or not?
- Counted on the order date, the payment date, or the delivery date?
- In which timezone does a day start and end?
- Converted from other currencies at which rate?
Two people answering these differently produces two revenue figures, and a meeting spent arguing about which is right. Write every metric down in plain language with its exact rule. That document becomes the specification for the automation.
Options, from simplest to strongest
1. A connected spreadsheet
Scheduled imports or small scripts pull data into a spreadsheet, and charts update automatically.
- Good for: one or two sources, small data, a quick win this week
- Watch for: fragile formulas, quota limits, and the usual spreadsheet-as-database problems
2. An automation tool feeding a store
A workflow tool such as n8n, Zapier or Make pulls from each source on a schedule and writes to a sheet or a small database.
- Good for: several sources, modest volume, no developer on staff
- Watch for: per task pricing that grows with data volume. See n8n vs Zapier vs Make.
3. A database with a dashboard tool on top
Data lands in a proper database. A dashboard tool such as Looker Studio, Metabase or Power BI reads from it.
- Good for: most growing businesses. Reliable, fast, and it scales a long way.
- Watch for: dashboard sprawl, where forty dashboards exist and nobody trusts any of them
4. A data warehouse and pipeline
Scheduled pipelines load many sources into a warehouse, with tested transformations.
- Good for: large volumes, many sources, several teams
- Watch for: building this before you need it. It is real ongoing work.
Most businesses are best served by option 3.
Build in quality checks
An automated report that is silently wrong is worse than a manual one, because people trust it more.
- Show a "last updated" time on every report, prominently.
- Alert when a source fails or returns nothing. A blank Monday should trigger a message, not a report full of zeros.
- Check row counts against expectations. Today's orders arriving as zero, or as five times normal, deserves a look before anyone makes decisions.
- Reconcile against the source weekly at first. Does the report's revenue match what the payment provider says?
- Watch for duplicates, the most common cause of numbers that are too high.
Deliver where people already look
Dashboards are often built, admired, and never opened again.
What works better for most teams:
- A short scheduled message in email or the team chat
- The three to five numbers that actually matter
- Each compared to last week and to target
- One line flagging anything unusual
- A link to the full dashboard for anyone who wants to dig
If a number would not change anyone's decision this week, leave it out of the summary.
Common problems
- Timezones. Your store uses one, your ad platform another. Pick one and convert everything.
- Source changes. An app renames a field and your pipeline quietly breaks. This is why the failure alerts matter.
- API limits. Pulling too much too often gets you throttled. Pull only what changed.
- Currency. Decide how and when you convert.
- Nobody owns it. Someone must be responsible for keeping each report correct.
How to start
- Pick the one report that costs the most hours each week.
- Write down every metric in it, with its exact rule.
- List the sources and check each has an API or export.
- Automate that one report end to end, including the checks.
- Run it next to the manual version for two or three weeks and compare.
- Switch off the manual version. Then pick the next report.
A simple connected report takes days. A proper pipeline across several sources usually takes a few weeks. If you want it built, show us the report you dread. Also see business tasks worth automating.


Comments